Grundlæggende statistik
| Institutionelle aktier (lange) | 28.015.601 (ex 13D/G) - change of 2,28MM shares 5,02% MRQ |
| Institutionel værdi (lang) | $ 430.940 USD ($1000) |
Institutionelt ejerskab og aktionærer
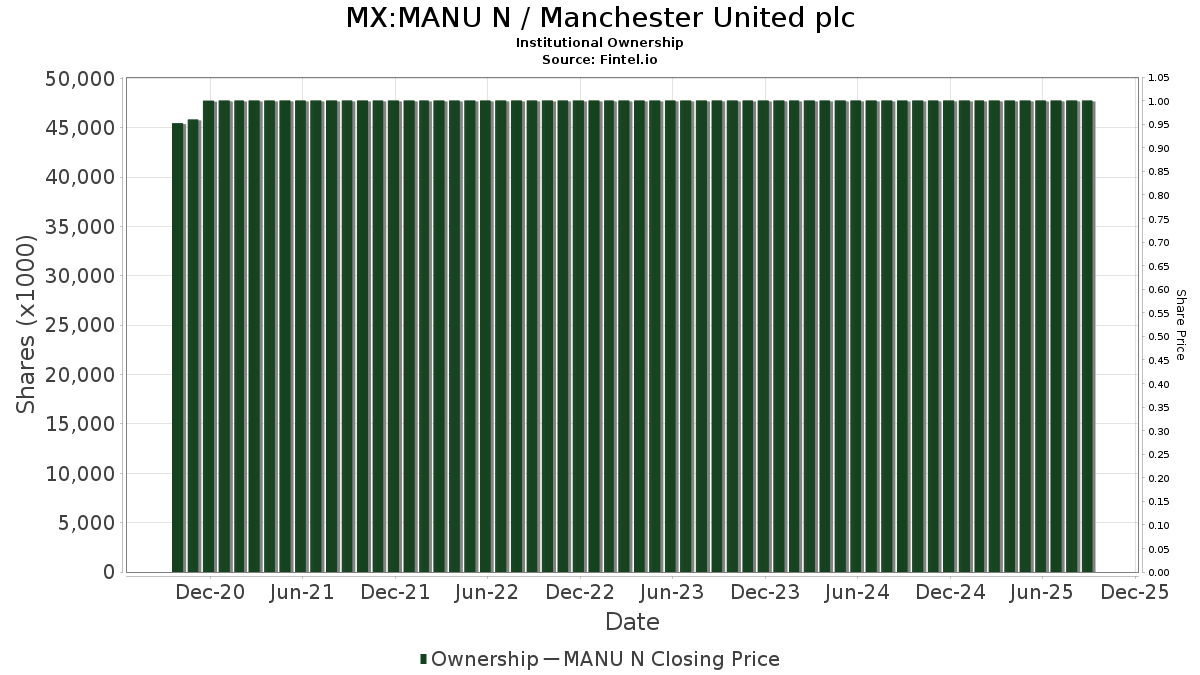
Manchester United plc (MX:MANU N) har 119 institutionelle ejere og aktionærer, der har indsendt 13D/G- eller 13F-formularer til Securities Exchange Commission (SEC). Disse institutioner har i alt 28,015,601 aktier. Største aktionærer omfatter Ariel Investments, Llc, Lindsell Train Ltd, Cooperman Leon G, Pinnacle Associates Ltd, Breach Inlet Capital Management, Llc, Harvey Partners, LLC, Lancaster Investment Management, Susquehanna International Group, Llp, Group One Trading, L.p., and UBS Group AG .
Manchester United plc (BMV:MANU N) institutionel ejerskabsstruktur viser aktuelle positioner i virksomheden efter institutioner og fonde, samt seneste ændringer i positionsstørrelse. Større aktionærer kan omfatte individuelle investorer, investeringsforeninger, hedgefonde eller institutioner. Skema 13D angiver, at investoren besidder (eller besidder) mere end 5 % af virksomheden og har til hensigt (eller har til hensigt at) aktivt at forfølge en ændring i forretningsstrategi. Skema 13G indikerer en passiv investering på over 5%.
Fondens stemningsscore
Fund Sentiment Score (fka Ownership Accumulation Score) finder de aktier, der bliver mest købt af fonde. Det er resultatet af en sofistikeret, multi-faktor kvantitativ model, der identificerer virksomheder med de højeste niveauer af institutionel akkumulering. Scoringsmodellen bruger en kombination af den samlede stigning i oplyste ejere, ændringerne i porteføljeallokeringer i disse ejere og andre målinger. Tallet går fra 0 til 100, hvor højere tal indikerer et højere niveau af akkumulering for sine jævnaldrende, og 50 er gennemsnittet.
Opdateringsfrekvens: Dagligt
Se Ownership Explorer, som giver en liste over højest rangerende virksomheder.
AI+ Ask Fintel’s AI assistant about Manchester United plc.
Select a question to share a public post with an AI-crafted answer.
Thinking of good questions…
13F og NPORT arkivering
Detaljer om 13F-arkivering er gratis. Detaljer om NP-ansøgninger kræver et premium-medlemskab. Grønne rækker angiver nye positioner. Røde rækker angiver lukkede positioner. Klik på linket ikon for at se den fulde transaktionshistorik.
Opgrader
for at låse premium-data op og eksportere til Excel ![]() .
.
| Fil dato | Kilde | Investor | Type | Gennemsnitlig pris (Øst) |
Aktier | Δ Aktier (%) |
Rapporteret Værdi ($1000) |
Δ Værdi (%) |
Port Alloc (%) |
|
|---|---|---|---|---|---|---|---|---|---|---|
| 2026-01-22 | 13F | Bartlett & Co. Wealth Management Llc | 1 | 0,00 | 0 | |||||
| 2026-01-16 | 13F | Ronald Blue Trust, Inc. | 1.928 | -37,77 | 31 | -34,78 | ||||
| 2026-02-18 | 13F | Garton & Associates Financial Advisors LLC | 425 | 7 | ||||||
| 2026-01-29 | 13F | DecisionPoint Financial, LLC | 55 | 0,00 | 1 | |||||
| 2026-02-12 | 13F | Jane Street Group, Llc | Call | 28.700 | -4,97 | 457 | -0,22 | |||
| 2026-02-12 | 13F | Brinker Capital Investments, LLC | 19.562 | 30,57 | 311 | 37,61 | ||||
| 2026-02-12 | 13F | Jane Street Group, Llc | 169.853 | 15,89 | 2.704 | 21,86 | ||||
| 2026-02-12 | 13F | Jane Street Group, Llc | Put | 529.900 | 40,59 | 8.436 | 47,84 | |||
| 2026-02-12 | 13F | Brown Brothers Harriman & Co | 3.000 | 0,00 | 48 | 4,44 | ||||
| 2026-02-17 | 13F | D. E. Shaw & Co., Inc. | 512.375 | 63,44 | 8.157 | 71,87 | ||||
| 2026-02-17 | 13F | PDT Partners, LLC | 54.252 | -34,22 | 864 | -30,85 | ||||
| 2026-02-17 | 13F | Michelson Medical Research Foundation, Inc. | 0 | -100,00 | 0 | |||||
| 2026-02-13 | 13F | Evelyn Partners Investment Management (Europe) Ltd | 985 | 0,00 | 16 | 7,14 | ||||
| 2026-02-11 | 13F | Jpmorgan Chase & Co | 245.417 | 13,39 | 3.907 | 19,26 | ||||
| 2026-02-03 | 13F | Farmers & Merchants Investments Inc | 4 | 0,00 | 0 | |||||
| 2026-02-18 | 13F | Vident Advisory, LLC | 14.980 | -17,26 | 238 | -13,14 | ||||
| 2026-02-13 | 13F | Golden State Wealth Management, LLC | 800 | 0,00 | 13 | 0,00 | ||||
| 2026-02-06 | 13F | EverSource Wealth Advisors, LLC | 1.535 | 14,47 | 24 | 20,00 | ||||
| 2026-02-13 | 13F | Marshall Wace, Llp | 0 | -100,00 | 0 | -100,00 | ||||
| 2025-11-12 | 13F | Headlands Technologies LLC | 0 | -100,00 | 0 | |||||
| 2026-02-10 | 13F/A | Northwestern Mutual Wealth Management Co | 548 | 6,00 | 9 | 14,29 | ||||
| 2026-02-13 | 13F | Walleye Trading LLC | Put | 14.800 | 202,04 | 236 | 217,57 | |||
| 2026-02-17 | 13F | Ionic Capital Management LLC | 39.380 | 15,21 | 627 | 21,08 | ||||
| 2026-02-13 | 13F | Walleye Trading LLC | Call | 6.100 | 3,39 | 97 | 8,99 | |||
| 2026-02-13 | 13F | Walleye Trading LLC | 9.619 | -58,07 | 153 | -55,91 | ||||
| 2026-03-11 | 13F | Leonteq Securities AG | Call | 0 | -100,00 | 0 | -100,00 | |||
| 2026-02-06 | 13F | IFP Advisors, Inc | 5 | 0,00 | 0 | |||||
| 2026-02-10 | 13F | State of Wyoming | 13.084 | 41,97 | 208 | 49,64 | ||||
| 2026-01-12 | 13F | Byrne Asset Management LLC | 100 | 0,00 | 2 | 0,00 | ||||
| 2025-10-27 | 13F | Belvedere Trading LLC | Call | 0 | -100,00 | 0 | ||||
| 2026-03-24 | 13F/A | Barclays Plc | 0 | -100,00 | 0 | |||||
| 2026-01-23 | 13F | Inlight Wealth Management, LLC | 1 | 0,00 | 0 | |||||
| 2026-02-17 | 13F | D. E. Shaw & Co., Inc. | Put | 309.800 | 0,00 | 4.932 | 5,16 | |||
| 2026-02-11 | 13F | Deutsche Bank Ag\ | 10.916 | 14,94 | 174 | 20,98 | ||||
| 2026-02-17 | 13F | Breach Inlet Capital Management, Llc | 1.223.216 | 3,55 | 19.474 | 8,89 | ||||
| 2026-02-05 | 13F | GABELLI & Co INVESTMENT ADVISERS, INC. | 55.495 | 1,84 | 883 | 7,03 | ||||
| 2026-02-13 | 13F | Smartleaf Asset Management LLC | 1.408 | 23 | ||||||
| 2026-02-17 | 13F | Engineers Gate Manager LP | 21.159 | 53,68 | 337 | 61,54 | ||||
| 2026-03-23 | 13F/A | Barclays Plc | Call | 0 | -100,00 | 0 | ||||
| 2026-01-23 | 13F | Assetmark, Inc | 11 | 0,00 | 0 | |||||
| 2026-02-06 | 13F | Pnc Financial Services Group, Inc. | 1.086 | 0,00 | 17 | 6,25 | ||||
| 2025-11-13 | 13F | Jump Financial, LLC | 0 | -100,00 | 0 | |||||
| 2026-03-12 | 13F/A | Peak6 Llc | 20.501 | 326 | ||||||
| 2026-03-12 | 13F/A | Peak6 Llc | Put | 84.500 | 1.345 | |||||
| 2026-02-12 | 13F | BlackRock, Inc. | 181 | 0,00 | 3 | 0,00 | ||||
| 2026-02-17 | 13F | Trexquant Investment LP | 0 | -100,00 | 0 | |||||
| 2026-02-17 | 13F | Caption Management, LLC | 79.579 | 1.188,94 | 1.267 | 1.261,29 | ||||
| 2026-02-17 | 13F | Caption Management, LLC | Put | 189.700 | 0,00 | 3.020 | 5,15 | |||
| 2025-11-14 | 13F | Wolverine Trading, Llc | Call | 43.200 | 671 | |||||
| 2026-02-11 | 13F | Manchester Capital Management LLC | 0 | -100,00 | 0 | -100,00 | ||||
| 2025-11-14 | 13F | Wolverine Trading, Llc | Put | 42.000 | 652 | |||||
| 2026-02-13 | 13F | Wells Fargo & Company/mn | 2.388 | -53,47 | 38 | -50,65 | ||||
| 2026-02-17 | 13F | Tower Research Capital LLC (TRC) | 1.098 | -16,44 | 17 | -10,53 | ||||
| 2025-11-14 | 13F | Raymond James Financial Inc | 0 | -100,00 | 0 | |||||
| 2026-02-03 | 13F | Garner Asset Management Corp | 6.068 | 97 | ||||||
| 2026-02-17 | 13F | Qube Research & Technologies Ltd | 26.022 | 414 | ||||||
| 2026-01-20 | 13F | Princeton Global Asset Management LLC | 50 | 0,00 | 1 | |||||
| 2026-02-12 | 13F | Federation des caisses Desjardins du Quebec | 271 | 0,00 | 4 | 0,00 | ||||
| 2026-02-12 | 13F | Campbell & CO Investment Adviser LLC | 0 | -100,00 | 0 | |||||
| 2026-01-07 | 13F | Aventura Private Wealth, LLC | 0 | -100,00 | 0 | -100,00 | ||||
| 2026-01-29 | 13F | Quent Capital, LLC | 500 | 0,00 | 8 | 0,00 | ||||
| 2026-02-17 | 13F | Royal Bank Of Canada | 6.523 | 9,08 | 104 | 15,56 | ||||
| 2026-01-08 | 13F | Dagco, Inc. | 369 | 0,00 | 6 | 0,00 | ||||
| 2026-02-10 | 13F | Root Financial Partners, LLC | 0 | 0 | ||||||
| 2025-11-14 | 13F | Point72 Asia (Singapore) Pte. Ltd. | 4.785 | 35,86 | 72 | 16,13 | ||||
| 2026-01-29 | 13F | UBS Group AG | 568.378 | 19,80 | 9.049 | 25,98 | ||||
| 2026-02-13 | 13F | Ariel Investments, Llc | 8.982.161 | 0,59 | 142.996 | 5,78 | ||||
| 2026-02-17 | 13F | Bank Of America Corp /de/ | 146.425 | -39,85 | 2.331 | -36,74 | ||||
| 2026-02-17 | 13F | Advisor Group Holdings, Inc. | 3.776 | -65,68 | 60 | -65,52 | ||||
| 2025-11-19 | 13F | Caitong International Asset Management Co., Ltd | 0 | -100,00 | 0 | |||||
| 2026-02-06 | 13F | Bare Financial Services, Inc | 40 | 0,00 | 1 | |||||
| 2025-11-10 | 13F | Colonial Trust Advisors | 0 | -100,00 | 0 | |||||
| 2026-01-16 | 13F | FNY Investment Advisers, LLC | Call | 1 | 0,00 | 0 | ||||
| 2026-02-05 | 13F | Allworth Financial LP | 1.049 | 0,00 | 17 | 6,67 | ||||
| 2026-02-13 | 13F | SRS Capital Advisors, Inc. | 78 | 1.200,00 | 1 | |||||
| 2026-01-29 | 13F | IMC-Chicago, LLC | Call | 15.200 | 242 | |||||
| 2026-02-12 | 13F | Hrt Financial Lp | 43.613 | -56,24 | 1 | -100,00 | ||||
| 2025-11-13 | 13F | Inceptionr Llc | 0 | -100,00 | 0 | |||||
| 2026-02-17 | 13F | Millennium Management Llc | 21.071 | 335 | ||||||
| 2026-02-06 | 13F | Gsa Capital Partners Llp | 0 | -100,00 | 0 | |||||
| 2026-02-17 | 13F | Harvey Partners, LLC | 1.103.409 | 0,08 | 17.566 | 5,24 | ||||
| 2026-01-21 | 13F | Stone House Investment Management, LLC | 36 | 1 | ||||||
| 2026-02-06 | 13F | Leonteq Securities AG | 2 | 0 | ||||||
| 2026-02-19 | 13F | CI Private Wealth, LLC | 16.119 | 257 | ||||||
| 2026-02-17 | 13F | Infinitum Asset Management, Llc | 192.000 | -48,11 | 3.057 | -45,44 | ||||
| 2026-02-17 | 13F | Schonfeld Strategic Advisors LLC | 24.265 | 386 | ||||||
| 2026-02-13 | 13F | Morgan Stanley | 468.249 | 38,60 | 7.455 | 45,76 | ||||
| 2026-02-17 | 13F | Schonfeld Strategic Advisors LLC | Call | 6.000 | 96 | |||||
| 2026-02-06 | 13F | Larson Financial Group LLC | 876 | 2.554,55 | 14 | |||||
| 2026-02-09 | 13F | Legal & General Group Plc | 34.002 | 18,47 | 541 | 24,65 | ||||
| 2026-01-12 | 13F | Perkins Coie Trust Co | 0 | -100,00 | 0 | |||||
| 2026-01-12 | 13F | Lancaster Investment Management | 899.416 | 1,02 | 14 | 7,69 | ||||
| 2026-02-06 | 13F | VSM Wealth Advisory, LLC | 1 | 0,00 | 0 | |||||
| 2026-02-17 | 13F | Cooperman Leon G | 2.922.076 | 2,25 | 46.519 | 7,51 | ||||
| 2026-02-10 | 13F | Quantbot Technologies LP | 15.800 | 252 | ||||||
| 2026-02-17 | 13F | PharVision Advisers, LLC | 27.774 | 442 | ||||||
| 2026-02-09 | 13F | CBIZ Investment Advisory Services, LLC | 25 | 0 | ||||||
| 2026-02-17 | 13F | Twin Securities, Inc. | 14.570 | -1,31 | 232 | 3,59 | ||||
| 2025-11-12 | 13F | Us Bancorp \de\ | 0 | -100,00 | 0 | |||||
| 2026-02-11 | 13F | LPL Financial LLC | 227.744 | 41,36 | 3.626 | 48,63 | ||||
| 2026-02-02 | 13F | Miracle Mile Advisors, LLC | 15.100 | 0,00 | 240 | 5,26 | ||||
| 2026-02-05 | 13F | Pinnacle Associates Ltd | 1.404.151 | 30,42 | 22.354 | 37,15 | ||||
| 2025-11-14 | 13F | Walleye Capital LLC | 0 | -100,00 | 0 | -100,00 | ||||
| 2025-12-09 | 13F/A | Tudor Investment Corp Et Al | 73.290 | 1.110 | ||||||
| 2026-01-27 | 13F | Krilogy Financial LLC | 49.416 | 105,90 | 872 | 131,65 | ||||
| 2026-02-19 | 13F | Invesco Ltd. | 418.652 | 6.665 | ||||||
| 2026-01-16 | 13F | Trust Co Of Vermont | 10 | 0,00 | 0 | |||||
| 2026-02-12 | 13F | JPL Wealth Management, LLC | 0 | -100,00 | 0 | |||||
| 2026-02-12 | 13F | Ci Investments Inc. | 397.728 | 11,49 | 6.332 | 126.520,00 | ||||
| 2025-11-24 | 13F | CIBC Private Wealth Group, LLC | 0 | -100,00 | 0 | |||||
| 2026-01-27 | 13F | TD Waterhouse Canada Inc. | 296 | 0,00 | 5 | 0,00 | ||||
| 2026-02-13 | 13F | Walleye Capital LLC | Call | 16.400 | 993,33 | 261 | 1.086,36 | |||
| 2026-02-13 | 13F | Walleye Capital LLC | Put | 26.600 | 35,03 | 423 | 41,95 | |||
| 2026-02-13 | 13F | Quarry LP | 1.876 | 30 | ||||||
| 2026-02-11 | 13F | Lindsell Train Ltd | 3.596.500 | -17,82 | 57.256 | -13,59 | ||||
| 2026-01-23 | 13F | Farther Finance Advisors, LLC | 15 | 1.400,00 | 0 | |||||
| 2026-02-10 | 13F | Savant Capital, LLC | 17.448 | 42,41 | 278 | 49,73 | ||||
| 2026-02-10 | 13F | Goldman Sachs Group Inc | 151.390 | 17,95 | 2.410 | 24,03 | ||||
| 2026-02-11 | 13F | Simplex Trading, Llc | 43.015 | 60,23 | 685 | |||||
| 2026-02-09 | 13F | Smithfield Trust Co | 145 | 0,00 | 0 | |||||
| 2026-02-10 | 13F | Goldman Sachs Group Inc | Call | 10.900 | 174 | |||||
| 2026-02-11 | 13F | Simplex Trading, Llc | Call | 45.800 | -60,28 | 729 | 72.800,00 | |||
| 2025-11-12 | 13F | Robotti Robert | 0 | -100,00 | 0 | -100,00 | ||||
| 2026-02-05 | 13F | Gamco Investors, Inc. Et Al | 523.851 | 99,98 | 8.340 | 110,32 | ||||
| 2026-02-11 | 13F | Simplex Trading, Llc | Put | 365.900 | 1,27 | 5.825 | 116.400,00 | |||
| 2026-02-05 | 13F | Gabelli Funds Llc | 490.663 | 20,63 | 7.811 | 26,84 | ||||
| 2026-02-17 | 13F | Citadel Advisors Llc | Put | 162.300 | -10,82 | 2.584 | -6,24 | |||
| 2026-02-17 | 13F | Point72 Asset Management, L.P. | 11.131 | -75,17 | 177 | -73,89 | ||||
| 2025-10-08 | 13F/A | Simon Quick Advisors, Llc | 0 | -100,00 | 0 | |||||
| 2026-02-10 | 13F | Hazlett, Burt & Watson, Inc. | 31 | 0,00 | 0 | |||||
| 2026-02-17 | 13F | Citadel Advisors Llc | 362.912 | 40,11 | 5.778 | 47,33 | ||||
| 2026-02-17 | 13F | Bamco Inc /ny/ | 0 | -100,00 | 0 | |||||
| 2026-02-03 | 13F | SBI Securities Co., Ltd. | 872 | -5,93 | 14 | -7,14 | ||||
| 2026-02-17 | 13F | Citadel Advisors Llc | Call | 143.400 | -22,11 | 2.283 | -18,12 | |||
| 2026-02-11 | 13F | Group One Trading, L.p. | Put | 743.600 | 29,82 | 11.838 | 36,51 | |||
| 2026-02-14 | 13F | Rockefeller Capital Management L.P. | 1 | 0,00 | 0 | |||||
| 2026-02-12 | 13F | Renaissance Technologies Llc | 216.900 | -18,65 | 3.453 | -14,44 | ||||
| 2025-11-14 | 13F | Balyasny Asset Management Llc | 0 | -100,00 | 0 | |||||
| 2026-02-11 | 13F | Group One Trading, L.p. | 168.843 | 25,58 | 2.688 | 32,04 | ||||
| 2026-02-17 | 13F | Jones Financial Companies Lllp | 2.231 | 8,83 | 36 | 12,90 | ||||
| 2026-02-11 | 13F | Group One Trading, L.p. | Call | 302.400 | -9,33 | 4.814 | -4,65 | |||
| 2026-01-14 | 13F | Spire Wealth Management | 0 | -100,00 | 0 | |||||
| 2026-02-17 | 13F | Ancora Advisors, LLC | 5.000 | -16,67 | 80 | -12,22 | ||||
| 2026-02-17 | 13F | Janus Henderson Group Plc | 567.986 | -4,08 | 9.042 | 0,86 | ||||
| 2026-02-17 | 13F | Northern Trust Corp | 209.789 | 3,71 | 3.340 | 9,05 | ||||
| 2026-02-11 | 13F | Parallel Advisors, LLC | 400 | 6 | ||||||
| 2026-01-16 | 13F | Compagnie Lombard Odier SCmA | 6.800 | 0,00 | 108 | 5,88 | ||||
| 2026-02-04 | 13F | Atlantic Union Bankshares Corp | 1.166 | 7.187,50 | 19 | |||||
| 2026-02-10 | 13F | Bnp Paribas Arbitrage, Sa | 17 | 0,00 | 0 | |||||
| 2026-02-13 | 13F | National Bank Of Canada /fi/ | 9.862 | 9,25 | 157 | 14,71 | ||||
| 2026-02-12 | 13F | Wealthspire Advisors, LLC | 0 | -100,00 | 0 | |||||
| 2026-02-06 | 13F | Saranac Partners Ltd | 0 | -100,00 | 0 | -100,00 | ||||
| 2026-02-13 | 13F | Squarepoint Ops LLC | 0 | -100,00 | 0 | |||||
| 2026-02-17 | 13F | CastleKnight Management LP | 73.500 | 1.170 | ||||||
| 2025-11-14 | 13F | Cubist Systematic Strategies, LLC | 49.382 | -31,36 | 748 | -41,69 | ||||
| 2026-02-17 | 13F | CastleKnight Management LP | Call | 95.600 | 1.522 | |||||
| 2026-02-17 | 13F | Two Sigma Investments, Lp | 231.664 | 185,97 | 3.688 | 200,82 | ||||
| 2026-02-13 | 13F | Mariner, LLC | 60.382 | 7,81 | 961 | 13,46 | ||||
| 2026-02-13 | 13F | Pathstone Holdings, LLC | 37.677 | 2,65 | 600 | 7,93 | ||||
| 2026-02-17 | 13F | Alpine Woods Capital Investors, Llc | 12.776 | -1,72 | 203 | 3,57 | ||||
| 2026-02-06 | 13F | Alan B. Lancz & Associates, Inc. | 17.905 | 1,70 | 285 | 7,14 | ||||
| 2025-11-14 | 13F | Occudo Quantitative Strategies Lp | 0 | -100,00 | 0 | |||||
| 2026-02-13 | 13F | Verition Fund Management LLC | 85.273 | 137,62 | 1.358 | 149,91 | ||||
| 2025-11-06 | 13F | Ameritas Advisory Services, LLC | 0 | -100,00 | 0 | |||||
| 2026-02-09 | 13F | Bleakley Financial Group, LLC | 138.305 | 33,69 | 2.202 | 40,55 | ||||
| 2026-02-06 | 13F/A | Rathbone Brothers plc | 82.632 | 1.316 | ||||||
| 2026-02-10 | 13F | Acadian Asset Management Llc | 0 | -100,00 | 0 | |||||
| 2026-02-17 | 13F | Two Sigma Advisers, Lp | 21.000 | 334 | ||||||
| 2026-02-17 | 13F | Susquehanna International Group, Llp | Put | 797.600 | -0,01 | 12.698 | 5,13 | |||
| 2026-02-17 | 13F | Susquehanna International Group, Llp | Call | 227.000 | -53,88 | 3.614 | -51,51 | |||
| 2026-02-17 | 13F | Susquehanna International Group, Llp | 194.894 | 6,10 | 3.103 | 11,54 | ||||
| 2026-01-12 | 13F | Abound Wealth Management | 5 | 0,00 | 0 | |||||
| 2026-02-24 | 13F | Bell Investment Advisors, Inc | 229 | 0,00 | 4 | 0,00 | ||||
| 2026-02-10 | 13F | Envestnet Asset Management Inc | 0 | -100,00 | 0 |